Collecting Intune Script Results Using Microsoft Graph
Hey there! Welcome to my very first blog post! I'm thrilled to kick things off by diving into one of my favorite topics: Microsoft Graph and Intune. If you're passionate about optimizing device management efficiency (and who isn't?), then you're in for a treat.
In this post, we'll explore an unconventional yet powerful method of using Platform Scripts to generate outputs that can be seamlessly retrieved through Microsoft Graph. This approach isn't widely known, but it's a game-changer for collecting detailed data directly from your devices without the hassle of writing script outputs to external storage solutions like Azure Storage Account Containers. Whether you need to inventory device models, manufacturers, or system specifications across your fleet, I'll walk you through a simple and effective way to achieve this using PowerShell and the Microsoft Graph API. Ready to script? Let’s jump in!

🛠 Writing the Script
First things first: you need a script! For this example, we'll keep it practical by collecting hardware information from all your devices. Knowing the exact hardware specifications of your devices is crucial for inventory management, planning upgrades, and troubleshooting.
Here's the script that will retrieve the computer's manufacturer, model, processor, and total physical memory using WMI:
# Retrieve system information using WMI
$systemInfo = Get-WmiObject -Class Win32_ComputerSystem
$processorInfo = Get-WmiObject -Class Win32_Processor

# Extract relevant properties
$manufacturer = $systemInfo.Manufacturer
$model = $systemInfo.Model
$processor = $processorInfo.Name
$totalMemoryGB = [math]::round($systemInfo.TotalPhysicalMemory / 1GB, 2)

# Organize the data into a hash table
$hardwareInfo = @{
    ComputerName     = $env:COMPUTERNAME
    Manufacturer     = $manufacturer
    Model            = $model
    Processor        = $processor
    TotalMemoryGB    = $totalMemoryGB
}

# Convert the hardware information to JSON format for easy parsing
$hardwareInfoJson = $hardwareInfo | ConvertTo-Json

# Output the JSON string
Write-Output $hardwareInfoJson
Save the script as, for example, get-hardwareinfo.ps1.
What this script does:
- Retrieves system information: Uses
Get-WmiObjectto get the manufacturer and model. - Gets processor information: Fetches the processor name.
- Calculates total memory: Converts total physical memory from bytes to gigabytes and rounds it to two decimal places.
- Organizes the data: Stores the collected information in a PowerShell hash table.
- Converts to JSON: Converts the hash table to a JSON string for easy parsing later.
- Outputs the data: Writes the JSON string to the output, which we'll collect later.
Here is a sample output from the Write-Output command:
{
    "ComputerName":  "Computer-x",
    "Model":  "Model-X",
    "Manufacturer":  "Manufacturer X",
    "TotalMemoryGB":  8,
    "Processor":  [
                      "Processor X",
                      "Processor Y"
                  ]
}
This script is a simple yet effective way to gather hardware details from your devices.
🚀 Deploy the Script in Intune
Now that you’ve got your script, let’s deploy it to your devices via Intune. Deploying scripts through Intune allows you to manage and automate tasks across your device fleet efficiently. By using Microsoft Graph to retrieve the script results, you eliminate the need to write outputs to storage solutions like blob storage. Here's how to do it step-by-step:
- Log in to Intune
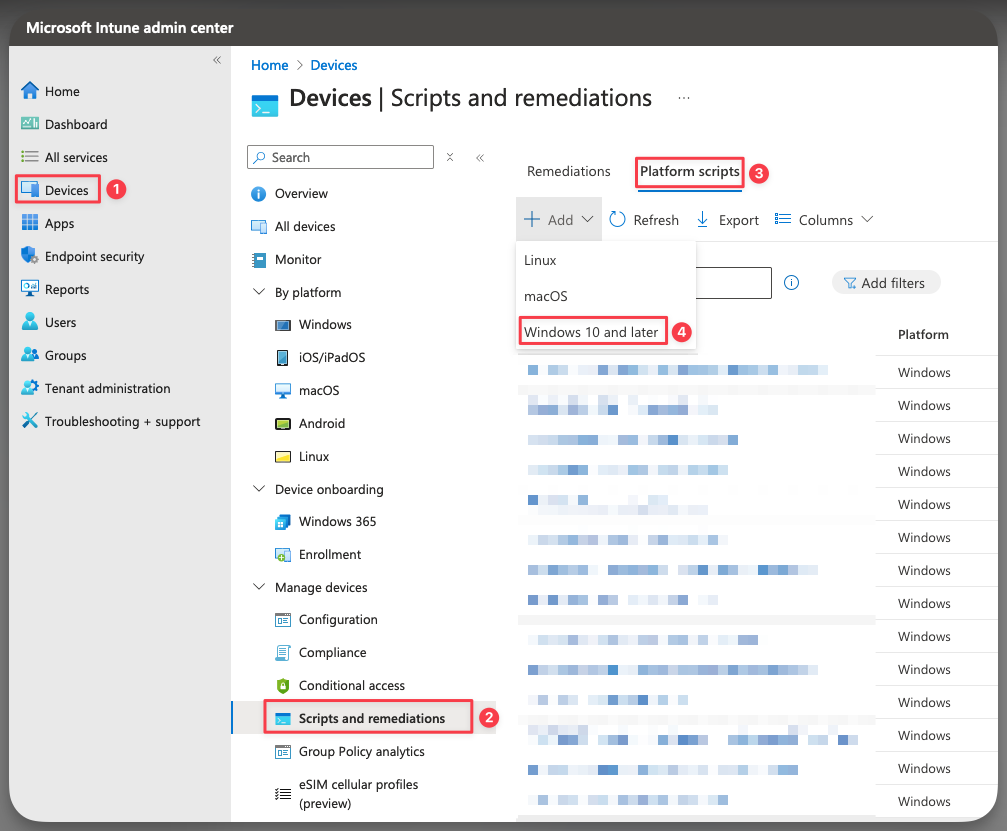
- Navigate to Devices > Scripts and remediations, then switch to the Platform scripts tab.
- Click Add > Windows 10 and Later
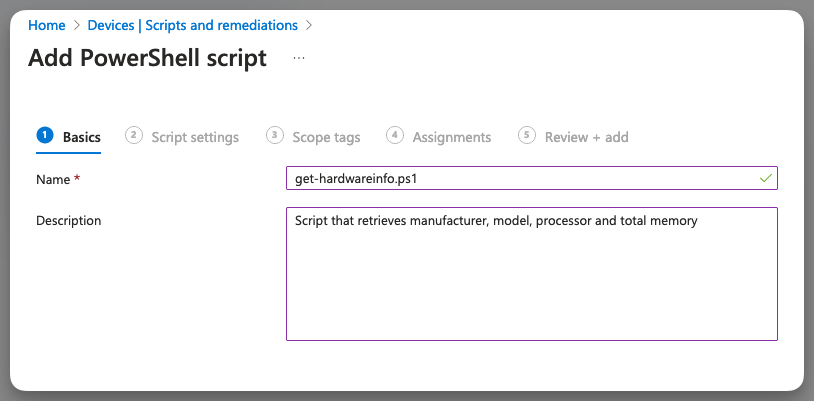
- Provide a Name for your script (stick to your naming conventions, it’ll save future-you a headache!) and a detailed Description (more detail, less confusion later).
- Click Next
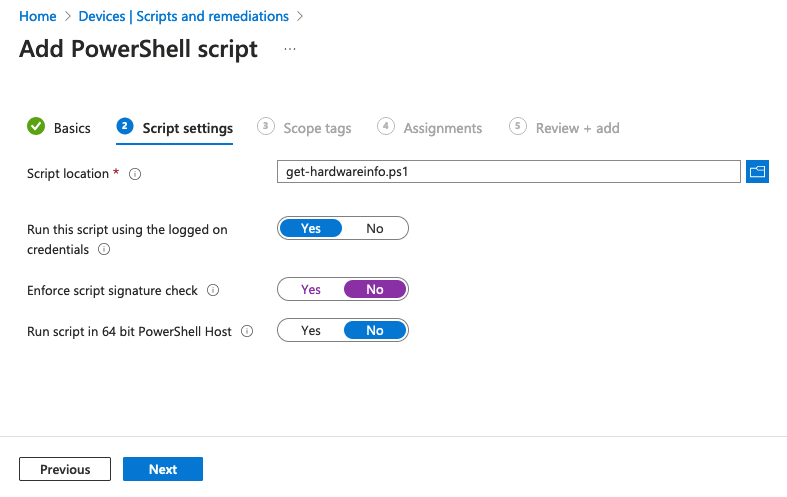
- Upload your script and set your preferences as shown in the image below.
Pro tip: If your script isn’t signed (and it probably isn’t), make sure Enforce script signature check is set to No.
- Click Next
- Apply any Scope Tags (if you need them)
- Click Next
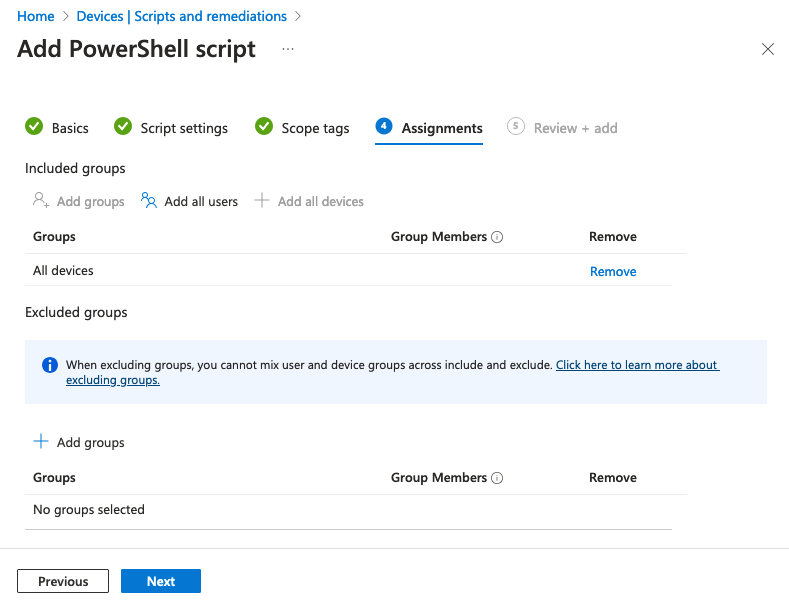
- Assign the script to the appropriate group
- Click Next
- Review your settings and if everything looks good, hit Add
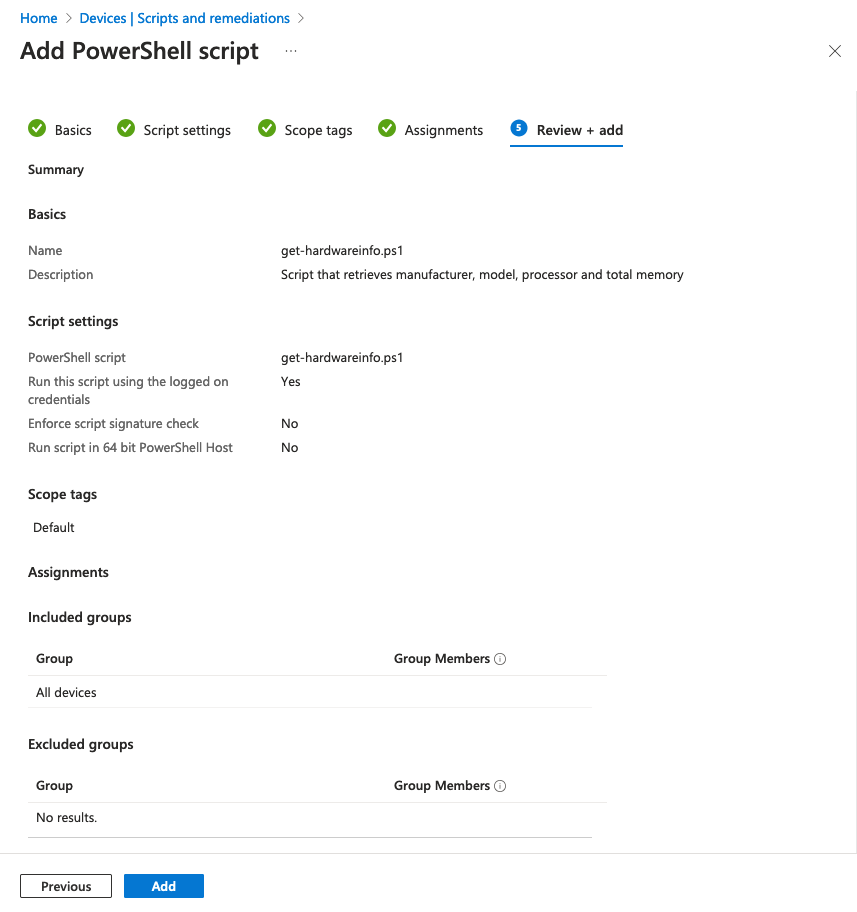
Now, grab a coffee ☕ and let Intune do its magic. It might take a little while, so be patient!
Executing PowerShell in Intune is much slower than applying policies or apps. It might take many hours before the PowerShell service kicks in on the client side.
🔍 How to collect Intune script results using Microsoft Graph (the Fun Part!)
Alright, your script is deployed and running on all your devices. But how do you see what it's doing? Traditionally, gathering script results can be a bit tricky, but we're going to use a lesser-known method that makes it a breeze. The easiest way is using Graph Explorer to retrieve the outputs directly from Microsoft Graph. This approach eliminates the need to store results externally, making the process more streamlined and efficient. Here’s how:
🆔 Find the ID of the Script
First, we need to grab the script’s ID. Don’t worry, it’s easy:
- Log in to Intune
- Navigate to Devices > Scripts and remediations, then click the Platform scripts tab.
- Click on your script.
- The ID is right there in the URL at the top of your browser. Easy peasy, as shown in this image:

In my case, the URL to the script page is:
https://intune.microsoft.com/#view/Microsoft_Intune_DeviceSettings/ConfigureWMPolicyMenuBlade/~/overview/policyId/99d0e662-580b-464d-821a-fed83087d17d/policyType~/0
Based on this URL, the ID for the script is:
99d0e662-580b-464d-821a-fed83087d17d
🧐 Preview Script Results in Graph Explorer
Now that we've got the ID, let's check out what's happening.
-
Open Graph Explorer
-
Sign in with your administrator account.
-
In the top bar, set it to GET (because we're getting results)
-
Select Beta (so we can access the cool new stuff)
-
Enter this URL:
https://graph.microsoft.com/beta/deviceManagement/deviceManagementScripts/<scriptID>/deviceRunStates?$expand=managedDeviceMake sure to replace
<scriptID>with the actual script ID you found earlier.In my case, the URL would be:
https://graph.microsoft.com/beta/deviceManagement/deviceManagementScripts/99d0e662-580b-464d-821a-fed83087d17d/deviceRunStates?$expand=managedDevice -
Hit Run query.
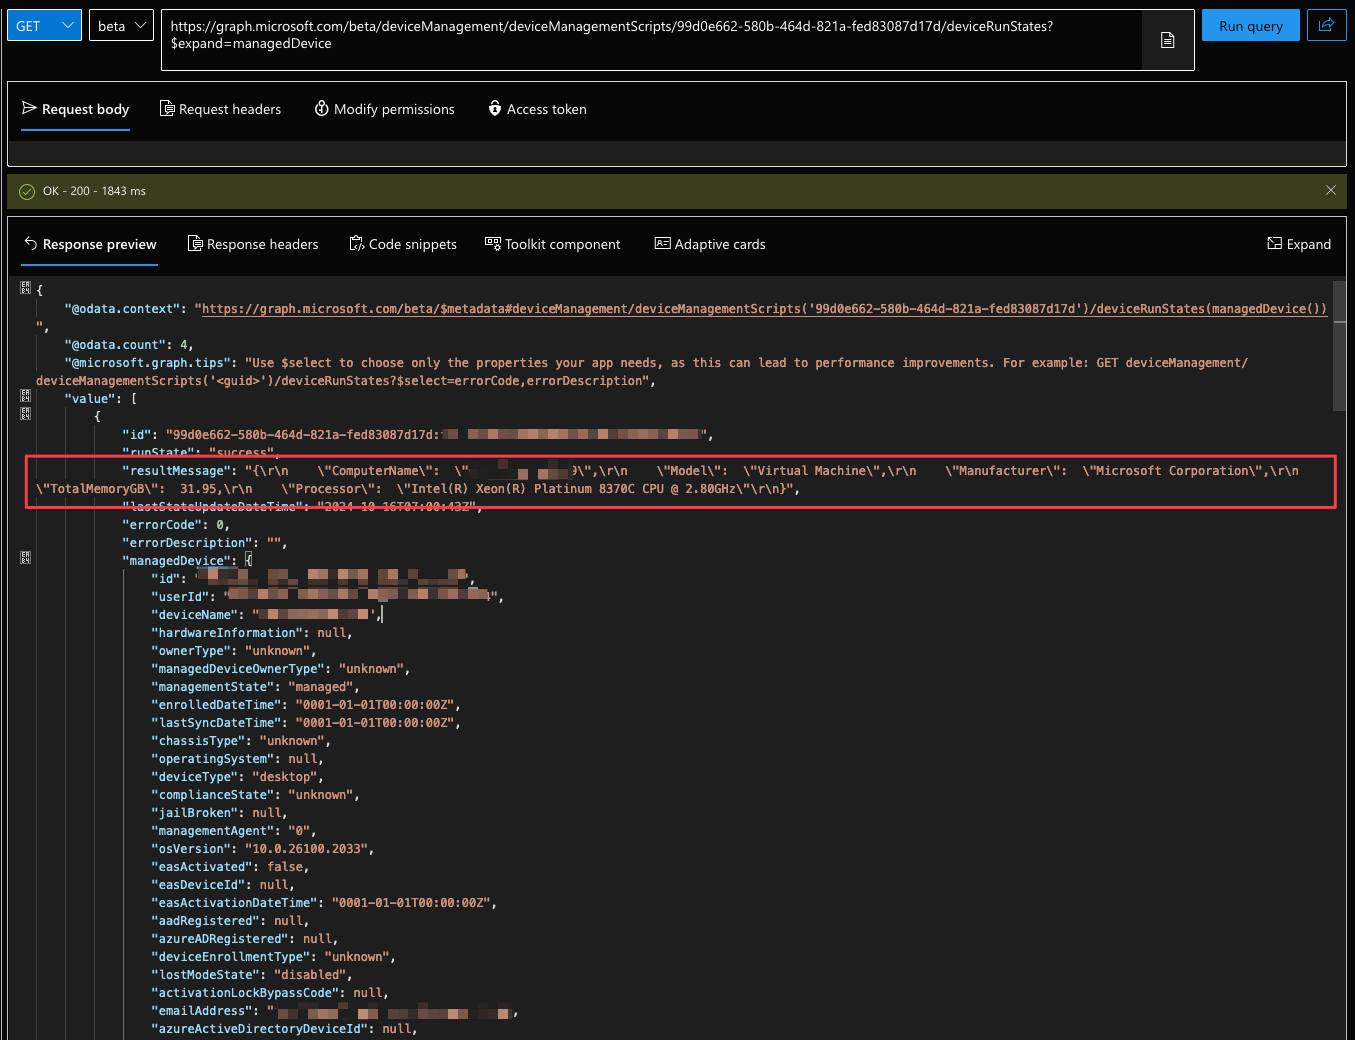
Graph Explorer will pull in the script results, which are stored in a neat little property called resultMessage. This unconventional approach allows you to peek directly into the results without jumping through hoops. The resultMessage is highlighted in the red square in the image below:
💡 Get Script Results in a Clean Table
Now for the fun part! Let’s use PowerShell to access Microsoft Graph and display the script results in a clean, user-friendly manner. Follow along:
-
Fire up PowerShell or your favorite code editor.
-
Run these commands:
Install-Module -Name Microsoft.Graph.Intune -Force -Scope CurrentUser
Import-Module Microsoft.Graph.Intune
Connect-MgGraph
The
Connect-MgGraphcommand will open a browser window and prompt you to log in. Log in with an account with Intune Administrator privileges or higher. -
Now, let’s fetch the results from the platform script in Intune using the Microsoft Graph PowerShell SDK:
# Define the script ID for the deployed Intune script
$scriptID = 'your-script-id'  # Replace with your actual script ID

# Retrieve the results of the script
$result = (Invoke-MgGraphRequest -Method GET -Uri "beta/deviceManagement/deviceManagementScripts/$scriptID/deviceRunStates?$expand=managedDevice").value

# Filter for successful results (errorCode = 0)
$success = $result | Where-Object -Property errorCode -EQ 0

# Parse the result messages and extract the hardware information
$parsedResults = $success | ForEach-Object {
   $hardwareInfo = [PSCustomObject]@{
      LastStateUpdateDateTime = $_.lastStateUpdateDateTime
      ComputerName            = ''
      Manufacturer            = ''
      Model                   = ''
      Processor               = ''
      TotalMemoryGB           = ''
   }

   # Try parsing the resultMessage JSON
   try {
      $json = $_.resultMessage | ConvertFrom-Json
      $hardwareInfo.ComputerName  = $json.ComputerName
      $hardwareInfo.Manufacturer  = $json.Manufacturer
      $hardwareInfo.Model         = $json.Model
      $hardwareInfo.Processor     = $json.Processor
      $hardwareInfo.TotalMemoryGB = $json.TotalMemoryGB
   }
   catch {
      Write-Warning "Failed to parse JSON for $_.lastStateUpdateDateTime"
   }

   # Return the parsed hardware information object
   $hardwareInfo
}

# Display the parsed results in a formatted table
$parsedResults | Format-Table LastStateUpdateDateTime, ComputerName, Manufacturer, Model, Processor, TotalMemoryGB -AutoSize

# Export the parsed results to a CSV file
$csvFilePath = "./ExportedHardwareInfo.csv"  # Replace with your desired file path
$parsedResults | Export-Csv -Path $csvFilePath -NoTypeInformation

Write-Host "Parsed hardware information has been exported to $csvFilePath"
Explanation:
- Retrieve results: The script fetches the script run states from Microsoft Graph using the specified script ID.
- Filter successful runs: It filters the results to only include runs where
errorCodeis0, indicating a successful execution. - Parse the JSON data: Each
resultMessagecontains JSON-formatted hardware information. The script attempts to parse this JSON and extract relevant details, such asComputerName,Manufacturer,Model,Processor, andTotalMemoryGB. - Display the data: The parsed information is displayed in a neatly formatted table in the terminal, making it easy to read directly from the console.
- Export to a CSV file: The structured hardware information is saved to a CSV file, with each property in a separate column for easy data analysis and manipulation.
Here is a sample output in the terminal from my run:

This approach provides a polished way to collect, display, and export hardware information from Intune script results. By converting JSON strings into structured data, you get a clean, organized view of the results, with the added convenience of exporting to a CSV file for further processing.
No more dealing with raw JSON output—just a user-friendly, readable format for all your hardware data needs!
📁 Link to Scripts
The scripts I have used in this blog post can be found here: https://github.com/marvika/digital-workplace-journal/tree/main/Samples/collecting-intune-deployed-script-results
🎯 Wrapping Up
One of the standout advantages of this unconventional approach is the ability to retrieve script outputs directly through Microsoft Graph, a feature that isn't available in the Microsoft Intune Admin Center. This capability unlocks a multitude of use cases, including:
- Enhanced Reporting: Generate comprehensive reports on script results without having the need for external storage solutions to send results to.
- Custom Monitoring: Implement tailored monitoring solutions that gather for example specific hardware or system information relevant to your organization's needs.
- Streamlined Troubleshooting: Quickly access script output to diagnose and resolve issues more effectively.
By deploying scripts and leveraging Microsoft Graph for result retrieval, you streamline your device management workflow, making it significantly simpler and more efficient. This method not only saves time but also reduces the complexity associated with managing and analyzing device data.
I hope this hidden gem opens up new possibilities for you in managing your endpoints. This was my first post, and I hope you found it helpful! Stay tuned for more on Intune, automation, and all things endpoint management. Until next time! 👋
